D3.js (Data Driven Document) is a JavaScript library that helps creating meaningful visuals for complex datasets. The gallery gives a wide overview of D3’s capabilities.
AirVantage, since version 13.3, provides a set of REST APIs focused on systems’ data. More specifically, it provides an API for getting aggregated data that enables the use of consolidation functions on historical datasets.
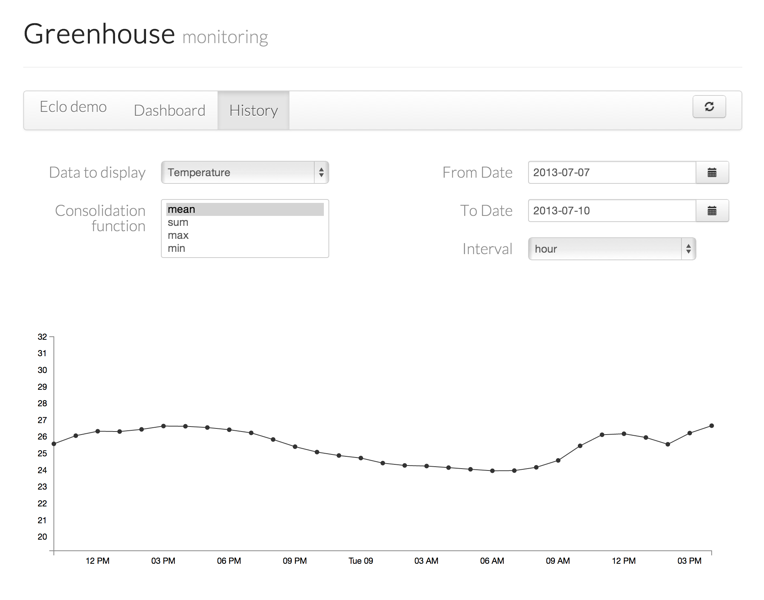
The eclo developer kit comes with a small web app that provides a basic graph (click here and then go to “History”) on top of these aggregated data thanks to D3. In this article we will see how this graph is built.
The historical aggregated datapoints API
Aggregated Data
Among the new data API provided by AirVantage, the aggregated datapoints is especially interesting. Indeed, AirVantage now provides some pre-treatments on numerical data sent by systems: it does the heavy lifting of aggregating large datasets on specific time windows through a set of consolidation functions. Let’s take an example.
Say we have a system on the field monitoring a greenhouse. It is sending to AirVantage the temperature measured by a probe every five minutes. The company operating this remote monitoring solution would like to work on some statistics and get the min and max for this temperature, for each day of the past month. This requires to retrieve all the data sent by the system, create a time window for each day and compute the min and max values for all these windows.
It require some infrastructure (database, etc) and can quickly become tedius, especially if you want to setup a lightweight client (web or mobile app) or if you have to deal with large numbers of datapoints. Since these kinds of computation are really common, AirVantage now provides a dedicated API.
AirVantage API
As for all the REST APIs of AirVantage, you first have to get an access token through one of the OAuth 2 workflow provided. Once this is done, you can use the following URL on the AirVantage domain: /api/v1/systems/{uid}/data/{data}/aggregated (you need to use the AirVantage uid of the system you want to request and the path of the data sent by your sytem). The query has the following parameters:
fromandto: timestamps of the time windowinterval: interval of time inside the time window on which data are consolidated (hour, day, …)fn: the consolidation function used (mean, min, max, standard deviation, sum, sum of square, number of datapoints)
Here is an example URL that requests the mean value of temperature each hour between Jully 8th and 10th 2013 on a specific system (the live demo of eclo):
http://edge.m2mop.net/api/v1/systems/f7d1eee04d0b4dc6af901cbdaacc83cd/data/greenhouse.data.temperature/aggregated?fn=mean&from=1373234400000&to=1373407200000&interval=1hour&access_token=...
The API will return an array of datapoints (an object with two fields: the value of the data at some point in time and the related timestamp) in JSON:
[{"value":25.591057284789755,"timestamp":1373270400000},
 {"value":26.079035574977755,"timestamp":1373274000000},
 {"value":26.345342803261424,"timestamp":1373277600000},
 ...]
As this dataset is already valid javascript we can directly use it with D3 to create the corresponding graph.
Basic graph with D3
Setup
In this example we will use the historical aggregated data API on a specific system. In order to do that, the following steps are required (please refer to the appropriate doc):
- An AirVantage account
- Create an API client in order to use the REST API
- Register a system that will send numerical value periodically
HTML
You first have to modify your HTML file (here index.html):
- Include the D3 library in your HTML file.
- And of course your own JS file (here aggregatedgraph.js next to index.html, that will contain the code to generate the graph.
- Add a div with a specific class. This class will be used by your D3 code as an anchor to generate the SVG for the graph.
<html>
   <head>
      <script src="http://d3js.org/d3.v3.min.js" charset="utf-8"></script>
      <script src="aggregatedgraph.js" charset="utf-8"></script>
   <head/>
   <body>
      <div class='graph'></div>
   </body>
</html>
Javascript
You can now create the aggregatedgraph.js file.
You need first to setup global constants that will be used for the graph:
var width = 940; // Width of the SVG element
var height = 400; // Height of the SVG element
var margin = 40; // Margin that will be used inside the SVG element
var plotRadius = 3; // Size of plots in the graph
var username = "eclo.demo@gmail.com"; // AirVantage user
var password = "eclo-live2013!"; // AirVantage password
var clientid = "eabea6f63e8346ceb8c4016f8e0f2740"; // Client id registered in AirVantage
var clientsecret = "54f40d77bbe348cb9e8b274fa25625ba"; // Secret key associated to the client
var systemuid = "f7d1eee04d0b4dc6af901cbdaacc83cd"; // The UID of the register system in AirVantage
var dataname = "greenhouse.data.temperature"; // The data path of the system
var airvantage = "http://edge.m2mop.net"; //AirVantage platform used
Then you can create global variables that will be shared by the various functions of your code
var svg; // The variable that hold the svg element
var grid; // The SVG group that contains the axis of the graph
var graph; // The SVG group that contains the graph itself
var token; // The OAuth token used by AirVantage REST API
AV REST API
You can now deal with AirVantage REST API (here we use the d3 json function that runs an http GET on the provided URL and handle the JSON response to the given callback). * First a function to manage authenetication and token recovery. This function can execute a callback once the token has been recovered. * Then a function to call the agregated historical data API and let the calback handle the data.
// Creation of the URL to request the token

// Recover the AirVantage token and then call the callback to trigger events as soon as the token
function getToken(clbk){
   var tokenURL = airvantage
      + "/api/oauth/token"
      + "?grant_type=password"
      + "&username=" + username
      + "&password=" + password
      + "&client_id=" + clientid
      + "&client_secret=" + clientsecret;

   d3.json(tokenURL, function(data){token = data.access_token; clbk()})
}

function getData(clbk){
   var dataURL = airvantage
      + "/api/v1/systems/" + systemuid
      + "/data/" + dataname
      + "/aggregated"
      + "?interval=1hour"
      + "&size=500"
      + "&access_token=" + token;

   d3.json(dataURL, clbk)
}
D3 graph
A first function is dedicated to the creation of the static elements of the SVG graph.
function init(){

    // Creation of the svg element
    svg = d3.select(".graph") // Select the HTML element of "graph" class
        .append("svg") // Add an SVG element
        .attr("width", width) // Set attributes
        .attr("height", height);

    // Creation of a group that will contain the axis of the graph
    // The group is translated from the value of the margin
    grid = svg.append("g")
        .attr("transform", "translate("+margin+" "+margin+")")

    // Creation of a group that will contain the data of the graph
    graph = svg.append("g")
        .attr("transform", "translate("+margin+" "+margin+")")

}
It is time to tackle the core of the application: tracing and updating the graph with a new dataset.
function plot(dataset){

    // Remove null value from the dataset
    var dataset = dataset.filter(function(data){return data.value != null})

    // Creation of a scale function that will map data value to vertical position
    // It takes as domain the min and max of the values
    var value_scale = d3.scale.linear()
        .domain([d3.min(dataset, function(i){return i.value}) * .8,
                 d3.max(dataset, function(i){return i.value}) * 1.2])
        .range([height-2*margin, margin])

    // Creation of the vertical axis constructor based on the value scale function
    // The axis will be automaticaly  adaped to the domain of the scale function
    var value_axis = d3.svg.axis().scale(value_scale).orient("left");

    // Extract the time domain from the timestamps dataset
    var time_extent = d3.extent(dataset, function(d){return d.timestamp});

    // Creation of a scale function for time
    var time_scale = d3.time.scale().domain(time_extent).range([0, width-2*margin]);

    // Creation of the horizontal axis constructor
    var time_axis = d3.svg.axis().scale(time_scale);

    // Discard the old axis before ading the new version
    // (in case the time and value domains have changed)
    grid.selectAll(".axis")
      .remove()

    // Creation the horizontal axis
    // (it need to be translated down as in SVG the origin is on top left corner)
    grid.append("g")
      .attr("transform", "translate(0," + (height-2*margin) + ")")
      .attr("class", "axis")
      .call(time_axis);

    // Creation of the vertical axis
    grid.append("g")
      .attr("class", "axis")
      .call(value_axis);

    // Select all the existing elements of the plot of the graph in case of update
    // Associate the new dataset to these elemnts
    // The Timesamp of the element is used as an identifier
    var g = graph.selectAll('.temperature').data(dataset, function(t){return t.timestamp})

    // Use of the enter function to create plots associated to new elements of the dataset
    // (the ones with new timestamp)
    // The plot is positionned according to is timestamp and value thanks to the scales function
    g.enter()
      .append('circle')
      .attr('class', 'temperature')
      .attr("cx", function(d){return time_scale(d.timestamp)})
      .attr("cy", function(d){return value_scale(d.value)})
      .attr("r", plotRadius+margin)
      .style("fill", "#333333")
      .style("opacity", "0")

    // Create an animation for all existing plots thanks to the transition function.
    // For the one added through enter, it changes the opacity and the radius.
    // For the one already in the dataset, it changes position in the newly created time and value scales.
    g.transition()
      .duration(500)
      .attr("cx", function(d){return time_scale(d.timestamp)})
      .attr("cy", function(d){return value_scale(d.value)})
      .attr("r", plotRadius)
      .style("opacity", "1")

    // Remove the plot that are no longer in the dataset thanks to the exit function
    g.exit()
      .remove()

}
Bootstrap
And last but not least, the entry point of the script. This function will be executed once the page has been fully loaded, and will init the whole application.
window.onload = function(){
    // Call init function
    init()
    // Recover the access token
    // Then the dataset and plot it
    getToken(function(){getData(plot)})
    // Add an action on the svg element:
    // On a mouse click the a new dataset is recovered and plot.
    svg.on('click', function(){getData(plot)})
}
Going Further
In order to get closer to a real app, it would be good to rely on a web framework that will enable to:
- Integrate this SVG visualization in a more complex web application (including the styling of the SVG elements using CSS)
- Manage REST calls properly (store auth token, use appropriate OAuth workflow, manage connection error, …)
- Work on user interaction (login, request of data, …)
In the eclo example, we used AngularJS but many others are available.
Moreover, the AirVantage API is not limited to aggregated data: last value and historical raw datapoints are also available, as long as many other ways to interact with your systems on the field.
This, combined to the almost limitless possibilities of D3, let you imagine complex visualization and interaction UI for your own solutions and customers.